Every year, Italian Young Geomorphologists (AIGeo) organizes a conference and field trip, dedicated to the young Geomorphologists. In this VIII Italian young geomorphologists’ day geomorphologists came from Italy, Europe, and also from out of Europe.
Thursday, June 24, 2021
Wednesday, June 23, 2021
21 JUNE - 'THE ZERO SHADOW DAY' ON TROPIC OF CANCER

Finding Tropic of Cancer through GPS
The Tropic of Cancer is a line of latitude circling the Earth at approximately 23.5° north of the equator. It is the northernmost point on Earth where the sun's rays can appear directly overhead at local noon. It is also one of the five major degree measures or circles of latitude dividing the Earth (the others are the Tropic of Capricorn, the equator, the Arctic Circle and the Antarctic Circle).
Some of the Earth's largest countries and/or cities are at or near the Tropic of Cancer. For example, the line passes through United States' state of Hawaii, portions of Central America, northern Africa, and the Sahara Desert and is near Kolkata, India. It should also be noted that because of the greater amount of land in the Northern Hemisphere, the Tropic of Cancer passes through more cities than the equivalent Tropic of Capricorn in the Southern Hemisphere.
Naming of the Tropic of Cancer
At the June or summer solstice (around June 21) when the Tropic of Cancer was named, the sun was pointed in the direction of the constellation Cancer, thus giving the new line of latitude the name the Tropic of Cancer. However, because this name was assigned over 2,000 years ago, the sun is no longer in the constellation Cancer. It is instead located in the constellation Taurus today. For most references though, it is easiest to understand the Tropic of Cancer with its latitudinal location of 23.5°N.
Significance of the Tropic of Cancer
The Tropic of Cancer is significant to Earth's geography because, in addition to being the northernmost point where the sun's rays are directly overhead, it also marks the northern boundary of tropics, which is the region that extends from the equator north to the Tropic of Cancer and south to the Tropic of Capricorn.

A Tropic of Cancer latitude passing through Ormanjhi, Ranchi, Jharkhand, INDIA
In addition to being used to divide the Earth into different parts for navigation and marking the northern boundary of the tropics, the Tropic of Cancer is also significant to the Earth's amount of solar insolation and the creation of seasons.
Solar insolation is the amount of incoming solar radiation on the Earth. It varies over the Earth's surface based on the amount of direct sunlight hitting the equator and tropics and spreads north or south from there. Solar insolation is most at the subsolar point (the point on Earth that is directly beneath the Sun and where the rays hit at 900 to the surface) which migrates annually between the Tropics of Cancer and Capricorn because of the Earth's axial tilt. When the subsolar point is at the Tropic of Cancer, it is during the June solstice and this is when the northern hemisphere receives the most solar insolation.

Sun's ray situation on 21 June
We can readily see that the Sun's vertical ray is striking the Earth overhead at 23.50N (Tropic of Cancer). The tropic marks the northern-most point at which the Sun will be overhead during the year. Poleward of 23.50N there is never a day when the Sun is directly overhead. Poleward of the Tropic of Cancer we will always have to look south to see the Sun. On June 21, when the Sun is directly overhead 23.50N, note that in shining 900, the Sun will extend not only to the North Pole (66.50 away from the Tropic of Cancer), but in fact an additional 23.50 (to make a total of 90 degrees) beyond the pole to the back side of the Arctic Circle (66.50N). Light shines 900 in all directions from the point where the Sun's ray is vertically overhead.
Light also shines 900 to the south from the Tropic of Cancer. This means that light will extend to the Equator (23.50) plus an additional 66.50 (to total 900) to the front side of the Antarctic Circle (66.5 0S).
If we could spin the Earth one rotation/one day, we would find that if we are anywhere between 66.5 degrees N and the North Pole, we would always be in light (24 hours). No darkness would occur because at no time would you rotate into the dark area. So with 24 hours of light, why is it not warm to hot in these polar areas? Keep in mind that we are a long way from the vertical ray of the Sun (it is at 23.50N). We have long days, but the low Sun angle means little heat energy is actually being received at the Earth's surface. Now, if we are located between 66.50S and the South Pole, we will on this date experience 24 hours of darkness because such locations are more than 900 away from the Sun's vertical ray.
An Example from INDIA:
On 21 June, 2021 we decided to go to find 'Tropic of Cancer' which was nearby us. Our living address's latitude is 23045.417' that means our location was just few minutes northward from Tropic of Cancer latitude, therefore we decided to find the exact place from which this important line is passing through.
We started our journey on almost 9:30 am on 21 June to go Adra (we calculated that Tropic of Cancer is passing through between Joychandi Pahar and Adra city). This month was very busy month for Monsoon rainfall, before today since three days we experiencing 4 days continuous rainfall. Today we seen sunny weather, so we were sure that it may possible to see the sun under clear cloud and weather that is why we also decided to go there to find the latitude. During our journey (one hour journey) we were so exited to see that the shadow of any two wheeler or four wheeler was accruing just vertical (on time 11:00 am).

Tropic of Cancer is passing through Adra (Purulia, West Bengal, INDIA) and ZERO SHADOW can be see through our bodies shadow
We reached Adra on about 11:40 am and very quickly we found the location from where Tropic of Cancer is passing with the help of GPS (Garmin). We drawn a line (Tropic of Cancer) and put a Sun dail (made by us). On accurate 12:00 pm we seen a slightly angled shadow on our Sun dial (this is because of IST is 82030 degree and we reached here late by 16 minutes 40 second) but We seen almost vertical (Zero shadow) here. We can understand this by following calculation:
Longitudinal difference Between Adra and Allahabad (IST)
Longitude (on GPS point) in Adra : 86040’283”
Longitude of IST (Naini, Allahabad) : 82030’000”
Hence longitudinal difference is : 4010’283 or 246
km
Time distance : 10 = 4 minute difference
Therefore, difference will be 4010’ = 16 minute 40”
Solar day (Vertical Sun’s ray falling time on Tropic of Cancer)
on Adra: 12:00 pm – 16:40 = 11 O'clock 43 minute 20
second
In this video we can see 'Zero Shadow' phenomenon; See attention fully on vehicle's shadows
(Because at 11:35 O'clock on 21 June, 2021 we were on the road journey; just few km before reaching Adra)

Bolero shadow falling vertical on the road

Omni shadow making zero shadow on the road

A car's shadow became zero

An Auto shadow possesses no any side angle

Measuring Tropic of Cancer by GPS and Verifying Zero Shadow by Sun Dail

Tropic of Cancer confirmation by our mobile's GPS
We were so happy to see the yearly phenomenon on Tropic of Cancer with our students. We read all this theoretical aspects but never verified this; it was first time when we implemented it in the field to check it out and we saw it really works. Therefore, we found that on 21 June, their is occurring 'Zero Shadow Day' on Tropic of Cancer.
How to Calculate the summer Solstice Sun Angle: During summer solstice, which occurs around June 21 every year, the Earth's axis is positioned relative to the sun such that northern hemisphere is closest to the sun and sourthern is farthest from the sun. The hemisphere closest from the sun experiences the summer solstice, with the direct rays of the sun falling 23.50 (Tropic of Cancer) north of the equator. Calculate the sun angle during the summer solstice for your location by determining your latitude and doing two simple calculations.
Consult an atlas or a geographical website to find the latitude of your location on Earth. For example, we are living in Asansol, our latitude is 23° 43' 42" N, or approximately 23.43°.

Longitudinal position of Asansol and Adra
Add 23°.5’ to your latitude to compensate for the fact that the sun's direct rays fall on one of the tropic lines during the summer solstice: the Tropic of Cancer for the northern hemisphere and the Tropic of Capricorn for the southern hemisphere. For example, if we live in Asansol, add 23°.5’ to 23°.4’ to get 56°.9’.
Subtract this value from 90° to get the angle of elevation from the horizon of the sun during midday on the summer solstice. In the above example, subtract 56.9° from 90 to get 33°.1’. This is the angle of elevation of the sun in Asansol at midday.
I am thankful for assisting to our lovable students during the field study e.g., i) Raja Chaurasia, ii) Arjun Nonia and iii) Abhijeet Kumar Shaw; I hope you all enjoyed and became evident this celestial phenomena first time in your life.
Tropic of Cancer passing through Ormanjhi, Ranchi, Jharkhand, INDIA

Sunday, June 20, 2021
SPATIAL ANALYSIS OF URBANIZATION IN SRIKAKULAM DISTRICT, ANDHRA PRADESH
SPATIAL ANALYSIS OF URBANIZATION IN SRIKAKULAM DISTRICT, ANDHRA PRADESH
Paper is original contributed by K. Tarakeswar Rao, Kharagpur (W.B.)
Urbanisation is an index of transformation from
traditional rural economies into modern industrial ones. It is a long term
process of transition from diffused patterns of human settlements to that of
concentration of buildup areas (Datta, P., 2006). Urban centres have always
been considered the nucleus of human civilization and culture. These activities
differ markedly from rural to urban areas. These secondary, tertiary and
quaternary activities of towns and cities promote the socio-economic
development of the region.
Andhra Pradesh has a total of 13 districts, (After
Bifarcated 2014 of Andhra Pradesh) The Anantapur district is the largest and
Srikakulam district is the smallest district. The districts are divided into
two regions of the state, i.e., Coastal Andhra and Rayalaseema and again
coastal Andhra divided into sub-regions i.e, south coastal Andhra and North
coastal Andhra comprises three districts Srikakulam, Vizianagaram and
Visakhapatnam.

Location map North Coastal Andhra Pradesh of Andhra Pradesh
Srikakulam district is
located on the northeastern part of Andhra Pradesh. The study area Srikakulam
district covering an area of 5,837 sq. km. Formerly
known as Chicacole, situated within the geographic co-ordinates of 180-20’
to 190-10’ N and 830-50’ to 840-50’ E. its
boundaries are the great Eastern Ghats run from North East. Vizianagaram
distric flanks in the south and west while Orissa bounds it on the north and
Bay of Bengal on the East. The district is divided into three revenue divisions
viz, Srikakulam, Palakonda and Tekkali with 38 constituent mandals (mandals
shown 38 numbers in study area map) comprising of 1802 villages. There are 12
urban units, of which are one Municipal Corporation, three Municipalities, One
Nagar Panchayat, and Seven are Census Towns, according to Census 2011.
Srikakulam
district has a total urban population of 4,36,703 in 2011. There are 12 urban
centers in Srikakulam district which is shown by Fig. no. 1 and table no. 1.
The smallest urban center is Hiramandalam, with a population size of only 6,603
and the largest one is Srikakulam Municipal Corporation with 1,56,443
population. Srikakulam MC is highly congested with 8,081 person/sq. km while
Ichchapuram Municipality has only 1,445 person/sq.
km. Urban population is only 16.16 % of the total population of Sikakulam
(2011).
Srikakulam mandal of Srikakulam district is the most
congested with 1,633 persons / sq. km. while Tekkali is the least congested
with 476 persons / sq. km.
Distribution of
Urban Population to the Total Population
1.
Low
(<25)
This category consists of three mandals viz., Hiramandalam, Ponduru and Sompeta. These three mandals have (13.2%, 17.11% and 23.8%) of the total population respectively. This mandals have (6,603, 12,640 and 18,778) persons as urban population, while the totalpopulation of the mandasl are (50,018, 73890 and 78908) persons. The urban density of three mandals are (2,589, 1142 and 1692) person/km2 respectively.
1.
Medium
(25-40)
Three mandals of this category are
Palakonda, Narasannapeta and Tekkali. The urban population of these mandals are
27.69%, 34% and 38.7% respectively. Palakonda have 20,760 urban population and
the total population of this mandal is 74,972 and occupies 6.15 km2 urban area. So the density of
this mandal is 3,376 persons/km2. Whereas Narasannapeta enjoys a total
population of 77,321 and the urban
population is 26,280 and covers an area of about 5.18 km2, so the
urban density of this block is 212 persons/km2. Tekkali have 28,631 urban
population and the total population of this mandal is 73,993 and occupies 13.58
km2 urban area. So the density of this mandal is 184 persons/km2.


2.
High
(>40)
This category includes Five mandals of
Srikakulam district i.e., Srikakulam, Palasa, Rajam, Amadalavalasa, and
Ichchapuram mandals. Percentage of urban
population to the total population is the highest in Srikakulam mandal i.e.,
68.56% whereas it is lowest in Ichchapuram mandal i.e., 41% (Fig. no. 1). The
total population of Srikakulam mandal is 2,41,408 and it covers an area of
about 29.63 km2. Therefore, urban density of this block is 7,125 persons/km2.
The urban density for remaining four mandals are 59.0% (Palasa), 44.9% (Rajam),
47.3% (Amadalavalasa), and 41.0% (Ichchapuram) respectively.
Distribution
of urban population to the rural population
In this urban population to the rural
population distribution we categorize it into three classes, which are as
follows:
1.
Low
(<50)
This category consists of four mandals namely
Sompeta, Hiramandalam, Palakonda and ponduru. In Sompeta mandal the percentage
of urban population to the rural population is 31.2%; and total rural
population is 60,130. In Hiramandalam mandal percentage of urban population to
the rural population is about 15.2%; and total rural population is 43,415. In
remaining two mandals viz, Palakonda and Ponduru percentage of urban population
to the rural population are 38.3% and 20.6%; and the total rural population in
these two mandals are 54,212 and 61,250 persons respectively.
2.
Medium
(50-100)
This category includes five mandals i.e.,
Ichchapuram, Tekkali, Rajam, Amadalavalasa and Narasannapeta which has 69.5%;
63.1%; 81.4%; 89.9% and 51.5% respectively. In Ichchapuram total rural
population is 52,472 persons, where as it are 45,362; 51,842; 44,294 and 51,041
persons in the remaining four mandals.
3.
High
(>100)
Two mandals come under this category. These are
Palasa and Srikakulam mandals. Srikakulam has a very high urban population
i.e., 206.1%. just because highly developed urban centres like Srikakulam MC
and Balaga city, therefore Srikakulam mandal has two urban centers with a total
urban population of 1,65,514
persons. Whereas the total rural population of this mandal is only 75,894
persons. Palasa has also a very high percentage of urban population to the
rural population is 143.6%; and the rural population in Palasa mandal is 40,044
persons.
Distribution of
urban centres per 100 km2
1.
Low
(<0.90)
Four mandals of Srikakulam district come under this
low category i.e.,Sompeta, Tekkali, Narasannapeta and Ponduru. The number of
urban centres per 100 sq.km each mandals are 0.84(Sompeta), 0.64(Tekkali), 0.81
(Narasannapeta), and 0.81(Ponduru) respectively.
2.
Medium
(0.90-1.10)
Under medium category there are five mandals namely.
Palasa, Hiramandalam, Palakonda, Rajam and Amadalavalsa. The number of urban
centres per 100 sq.km each mandals are 0.93(Palasa), 0.97(Hiramandalam),
0.93(Palakonda), 0.91(Rajam) and 1.10(Amadalavalsa) respectively.
3.
High
(>1.10)
Two Mandals(blocks) are found in this high category,
namely Srikakulam and Ichchapuram. In Srikakulam mandal two urban centres are
located. Srikakulam Municipality Corporation and Balaga town are the urban
centers in Srikakulam Mandal. The total area of Srikakulam mandal is 134.95 km2,
so the number of urban centers per 100 sq.km is highest which is 1.48. While in
Ichchapuram mandal the number of urban centers per 100 sq.km is 1.35. in this
mandal one urban center, and the total area of this mandal is 74.03 km2.
In Fig. no. 3
Urban location with different geographical entities (Vegetation, Gardens, water
bodies, transport, settlements etc.) is shown in fig. no. 2. It is very clear
picture that highly and densely populated settlement are located in the central
- urban functional zone in Srikakulam MC, whereas there is low settlement and
low density in the peripheral and remote zones of the city. Srikakulam MC has
highest (1,37,944)
Urban Population and highest
(7,125) Density of the Srikakulam District. This is Administrative city
and Headquarter of Srikakulam District.

Conclusion
It
may be conclude that the pattern of regional variation in the distribution of
urbanization is much similar to that of urban population to the rural
population and the distribution of urban centers. The regional variations of
urbanization may be visualized to that of the urban population as the
percentage of total and rural population and number of urban centers per 100
sq. km. However the range of variation is considerably wide (13.2 to 68.56%) for the urban population to
the total population; (15.2
to 206.1%) for the urban population to the rural population and (0.64 to 1.48%) for the case of urban
centers per 100 sq. km. Urban variation are high (above 40%) particularly in Srikakulam,
Amadalavalasa, Rajam, Palasa and Ichchapuram mandals (Blocks); medium (25 – 40%)
in Tekkali, Narasannapeta, Palakonda mandals and low (below 25%) in Sompeta,
Ponduru and Hiramandalam mandals of the District. 16.2% urban population is
very low in this district. There are 12 urban centres out of 38 mandals (Blocks).
Inspite 5 (Five) mandals are above 40% urban population out of 38 mandals in
this district. Infact a reflection of higher levels of Industrial and Economic
Development is observed in particularly above 40% urbanization mandals and
Srikakulam and Palasa mandals are a very high percentage of Urban Population to
the Rural Population i.e., 206.1% and 143.6% respectively. Such as Srikakulam
Municipal Corporation and Balaga town are two urban centres in Srikakulam mandal.
So the number of urban centres per 100 Sq. km. is highest i.e., 1.48 in
Srikakulam, while in Ichchapuram mandal the number of urban centres per 100 Sq.
km. is 1.35 of the Srikakulam District.
REFERENCES:
1.
Datta, P., 2006: ‘Urbanisation in
India’, Abstract of Regional and Sub-Regional Population dynamic population
process in urban areas, European population conference, 21-24 June.
2.
Munir, A; Khan, K. and Nasir, J., 2007:
Spatial analysis of urbanisation in Dehra Dun district, Uttarakhand,
Geographical Review of India, Kolkata 69 (2) June, pp. 162-169.
3. Singh,
R.B., 1993: Process of organization in the third world et. Al. Diddec, J.and
Rangaswamy, V., Urbanization, Trends, Perspective and Challenges, Rawat Publication,
Jaipur, pp. 55-74.
4. Bhattacharya,
S., and Rathi, S., 2015: Reconceptualising Smart Cities: A Reference Framework
for India, (CSTEP-Report-2015-03), p. 18.
5. NITI Aayog, 2015
6.
Annez, P.C. and R.M. Buckley (2010):
‘Urbanization and Growth: Setting the context’, in M. Spence, P.C. Clark and R.
M. Buckley (eds.), Urbanization and Growth, Rawat Publ., Jaipur, P. 1.
7. Relevantly Landes, D.S., 1969.
8.
Lucas, R.E., Jr., 2004: ‘Life earnings
and rural – urban migration’, Journal of Political Economy, Vol. 112, No. 1,
Part – 2, P. S56.
9.
Burgess, R. & Venables, A. J., 2004:
‘Towards a macroeconomics of growth’, World Bank, Washington, DC, pp. 1-50.
10.
Reddy, G.P.O. and Rao, M.S., 1999:
Environmental Impact Assessment – A case study of Anantpur district,
Geographical Review of India, Vol. 61, No. 1, March, pp. 55 – 65.
11.
Fajal, S., 2000: Urban expansion and
loss of agricultural land – A GIS based study of Saharanpur city, India,
Environment and Urbanization, Vol. 12, No. 2, October, pp. 133 – 150.
12.
Kothari, S. and Kohli, A., 2002:
Urbanization and urban poverty in India – A regional analysis, Geographical
review of India, Vol. 64, No. 4, pp. 131 – 136.
13.
Kaushik, S., 2003: Trends of
urbanization in India, some insight from the census 2001, Geographical review,
Vol. 65, No. 2, June, pp. 181 – 188.

Saturday, June 19, 2021
शैक्षणिक भ्रमण (EXCURSION) - उसकी महत्वता
चूँकि भूगोल पृथ्वी के धरातल सम्बन्धी चीजों का अध्ययन करता है इसलिए यह अतिआवश्यक हो जाता है कि सैद्धांतिक पक्ष जो कक्षाओं में बताया जाता है उसका व्यावहारिक पक्ष अथवा वश्ताविक स्थलाकृतियों की जाँच उसी वातावरण में जाकर करे जिससे सही तरीके से भूगोल को समझा जा सके।
प्रादेशिक भूगोल का प्रत्यक्ष रूप से शैक्षणिक भ्रमण से है जो व्यक्ति जितना ज्यादा अपने जीवनकाल में भ्रमण किया हुआ रहेगा उतना उसका प्रादेशिक भूगोल मजबूत होगा।

एन० डी० राष्ट्रीय विद्यालय (एच० एस०), सीतारामपुर के विद्यार्थियों द्वारा जबलपुर का शैक्षणिक भ्रमण
शैक्षणिक भ्रमण की महत्वो को निम्नलिखित तरीको से समझा जा सकता है
१. पुनर्ताजगी (Reinforcement) एक विद्यार्थी जो भूगोल को स्कूल या कॉलेज की कक्षाओं तक उसका सैद्धांतिक पक्ष समझता है भ्रमण कर उस स्थलाकृतिक चीजों को अच्छी तरह समझ सकता है।
२. व्यस्तता (Engagement) शिक्षक विद्यार्थियों को पढ़ाने के लिए एक चलित कक्ष (Mobile classroom) में बदल सकता है जहाँ विद्यार्थीओ को उस क्षेत्र में जाकर वहां के आंकड़े का संग्रहण एवं विश्लेषण द्वारा उन्हें व्यस्त किया जा सकता है जिससे कुछ नए तथ्य एवं विधि विद्यार्थी सीख पाते है।

जबलपुर का शैक्षणिक भ्रमण के द्वारान छात्र पहली बार संगमरमर चट्टान का एवं नर्मदा नदी के द्वारा निर्मित गोर्ज का अवलोकन कर रहे थे जो छात्र अपने अनुभव एवं ज्ञान दोनों स्तर पर सीखे
४. दिखावाकरण (Exposure) जो शैक्षणिक भ्रमण नहीं जाते है उनकी तुलना में जो बच्चे भ्रमण करने जाते है कुछ नयी एवं प्रायोगिक बाते सीख पाते है। जिससे बच्चो का व्यावहारिक ज्ञान उन्नत होता है।

आगरा शैक्षणिक भ्रमण के द्वारान एक छात्रा का सेल्फी स्टाइल
५. जिज्ञासुपन (Curiosity) चूँकि बच्चे जिज्ञासुपन वाले होते है और शैक्षणिक भ्रमण में जाकर उनकी जिज्ञासा शांत होती है फलस्वरूप बच्चो के ज्ञान की सीमा में बढ़ोतरी होती है।
६. अवधारण (Retention) बच्चो के मानसपटल पर शैक्षणिक भ्रमण का जो प्रभाव पड़ता है उसका सकारात्मक पहलु यह भी है कि बच्चो में धारावाहिक यादास्त (Episodic memories) में वृद्धि होती है जो बच्चो को आगे के ज्ञान हासिल करने में मदद करता है।
७. नए जगह का भ्रमण (Excursion to new sites) शैक्षणिक भ्रमण द्वारा बच्चे नए - नए जगहों को देखकर समझ पाते है जो कक्षा में बैठकर पढ़ने से अच्छा है।

एन० डी० राष्ट्रीय विद्यालय (एच० एस०), सीतारामपुर के विद्यार्थियों द्वारा पहली बार आगरा के ताजमहल का अवलोकन
८. जिम्मेवार (Boarding) बच्चे जब समूह में भ्रमण करने जाते है तब अपने सहपाठियों एवं शिक्षकगण से व्यक्तिगत तौर पर जुड़ पाते है एवं यह अनुभव विद्यार्थीओ को जिम्मेवार बनाता है।
९. गैर-परंपरागत शैक्षणिक वातावरण (Informal Learning Environment) चूँकि शैक्षणिक भ्रमण के द्वारन गैर-परंपरागत तरीको द्वारा ज्ञान प्राप्त किया जाता है जिससे किसी प्रकार कि कोई पुस्तक सामग्री नहीं होती बच्चे मौखिक रूप से ही आसानी से ज्ञान प्राप्त कर लेते है।

११. दृश्टिकोण का विकास (Development of Perspective) चूँकि बच्चे उसी वातावरण में ना रहकर दूसरे वातावरण में जाते है जहाँ की भाषा, स्थलाकृति, लिपि, वेश-भूषा अलग हो सकती है i दूसरे सांस्कृतिक दृश्यों को दूसरे वातावरण में जाकर सीखने से एक प्रकार की बच्चो में दृश्टिकोण का विकास होता है जो बच्चो में बाद में जाकर बहुआयामी विकास में मदद करता है।
१२. सीखने की पद्दति का विकास (Development of Learning Style) शैक्षणिक भ्रमण द्वारा बच्चो में अलग - अलग सीखने की पद्दति का विकास होता है जो विषयो को समझने में मदद करता है।
१३. व्यस्त कक्षाओं के बीच थोड़ी उलहङपन (Break from the Routine) स्कूल या कॉलेज की कक्षाएं काफी व्यस्त होती है जिसमे से जब विद्यार्थी समय निकालकर किसी दूसरे प्रदेश में जाते है तो उन्हें थोड़ा उलहङपन करने का मौका मिल जाता है जो उनके मानसिक स्थिरता प्रदान करता है।
१४. कुछ नया सीखना (Learn Something New) शैक्षणिक भ्रमण द्वारा बच्चे दूसरे प्रदेश में जाकर कुछ नया सीखते है जो शायद कक्षा में कभी पढ़े ही ना हो।
१५. एक व्यावसायिक तरीके का व्यव्हार करना (Teaches Professionalism) शिक्षक एक विद्यार्थी से यह आशा रखता है कि जब वे सब एक भ्रमण हेतु कक्षा के बाहर जाये तो उनमे एक व्यावसायिक तरीके की तरह व्यव्हार को जो बच्चो को व्यावहारिक बनने में मदद करेगा।
१६. वास्तविक दुनिया का अनुभव (Red world Experience) शैक्षणिक भ्रमण द्वारा बच्चे दूसरे वातावरण में जाकर वास्तविक दुनिया का अनुभव कर पाते है एवं जीवन जीने की कला को सीखते है।
१७. समुदाय से संपर्क (Connectivity to community) भ्रमण द्वारा बच्चे नए समुदायों द्वारा संपर्क करते है जिसमे उनके परम्पराओ के बारे में सीख पाते है।

एन० डी० राष्ट्रीय विद्यालय (एच० एस०), सीतारामपुर के विद्यार्थियों द्वारा आगरा शैक्षणिक भ्रमण के द्वारान डेनमार्क के दम्पति द्वारा वार्तालाप
१८. कक्षाओं में प्रेरणा (Classroom Inspiration) जब बच्चे भ्रमण कर वापस लौटते है तब वे बहुत कुछ नया सीखे हुए होते है जो बच्चो को प्रेरणा देती है कुछ अच्छा और नया करने के लिए।
१९. स्वयं निर्भरता (Self dependency) बच्चे घर में या कक्षा में माता - पिता अथवा शिक्षक - शिक्षिका पर निर्भर होते है जिसमे कई तरह के रुकावटे होते है किन्तु भ्रमण के द्वारा बहुत सारी काम बच्चो को स्वयं करना होता है जैसे अपना बैकबैग उठाना, जिससे आत्मा निर्भरता बच्चो की बढ़ती है।
निष्कर्ष : अतः हम कह सकते है कि शैक्षिणिक भ्रमण एक विधि है जिसके माध्यम से बच्चो के अंदर छिपी हुई शक्तियों का भरपूर उपयोग उनके व्यावहारिक ज्ञान को सवारने में किया जा सकता है जिससे बच्चो के भीतर बहुआयामी विकास हो पाने में मदद मिलती है।
एन० डी० राष्ट्रीय विद्यालय (एच० एस०), सीतारामपुर के विद्यार्थियों द्वारा जबलपुर, मध्य प्रदेश का शैक्षणिक भ्रमण (वर्ष - 2017)
एन० डी० राष्ट्रीय विद्यालय (एच० एस०), सीतारामपुर के विद्यार्थियों द्वारा आगरा, उतरप्रदेश का शैक्षणिक भ्रमण (वर्ष - 2018 - 2019)

Subscribe to:
Posts (Atom)
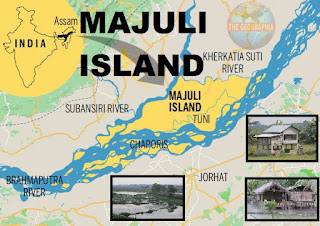
MAJULI ISLAND - WORD'S BIGGEST RIVER MADE ISLAND IN BRAHMPUTRA
Majuli Island - Mājuli or Majoli is a river island in the Brahmaputra River, Assam and in 2016 it became the first island to be made a dist...
-
 Parasnath hill - elevation ... 1365 meter (Photography from another top point) Parasnath is located towards the eastern end of the Chota N...
 -
 Finding Tropic of Cancer through GPS The Tropic of Cancer is a line of latitude circling the Earth at approximately 23.5° north of the equat...
 -
 #Gullyerosion #GullyerosioninGangani #GullyerosioninMedinipur #GullyerosioninBengal #GullyerosioninGanganiGarbeta #TheGeographia #Gullyero...